close-up of Cobra Probe head Series 100 Cobra Probe ECA Probe Dynamic Pressure module Calibration traverse
  Turbulent Flow Instrumentation logo  
  Home Products Services Support Downloads Company  

Products

  • Cobra Probe
  • DPMS
  • ECA Probe
  • Device Control
  • - R-TAC module

    - R-TAC video

  • Other
  • FAQs
  •  


    R-TAC Software Module

    The R-TAC Real-Time Animated Contouring software module works with the Device Control software and a DPMS multi-channel pressure measurement system. It allows the simultaneous display of many channels of pressure data in the form of pressure contours, while data is being sampled in real-time, or later on after sampling is completed. It assists the user to check data integrity while the data is being collected and allows visual interpretation of some complex flow structures without waiting for time-consuming post processing.

    Read on for a brief guide to R-TAC operation and click on any of the images on this page to see a larger version of them. To see the real-time contouring display in action, watch the R-TAC video.


    - Create An Image

    - Pressure Taps

    - Contour Zones

    - Contour Generation


    Using R-TAC

    In order to visualise pressure contours during testing, or after the data has been collected, four steps are involved: creating and importing an image into R-TAC; specifying the pressure tap (measurement) locations; specifying the area over which to generate the pressure contours; and commencing sampling. These steps are briefly described below.
    Image Importation
    In order to provide context to the visualised pressure contours, an image (photo or drawing) of the item being tested can be imported into R-TAC. Acceptable image formats include: *.jpg, *.jpeg, *.bmp, *.emf, *.wmf. The image can be as simple or as complex as desired. Shown at right is a composite photo of the 4 faces of a building model, with the pressure taps visible on the building faces.

    An image showing the 4 faces of a model building for testing

    Pressure Taps

    The user specifies the location of the pressure taps (or a contour generation point) by clicking on the imported image with a user-friendly tool. The tap coordinates can also be entered or altered using a spreadsheet-like interface. Each tap is assigned to a particular channel of data or an arithmetic calculation involving one or more channels of data - data can be normalised for example. Each tap can be given a unique, relevant label to allow easy identification.

    Pressure taps are created and positioned on the image

    Contour Zones

    Taps are grouped into zones that define an area for pressure contour generation, thus ensuring that contours are not indiscriminately generated over edges or between faces. For example, each face of a building model can be assigned an independant zone, allowing all faces to be contoured and displayed simultaneously. The creation of zones completes the configuration process and the whole configuration (including image file, tap and zone information) can then be saved for future use.

    Zones are defined to indicate the areas for pressure contour generation

    Contour Generation

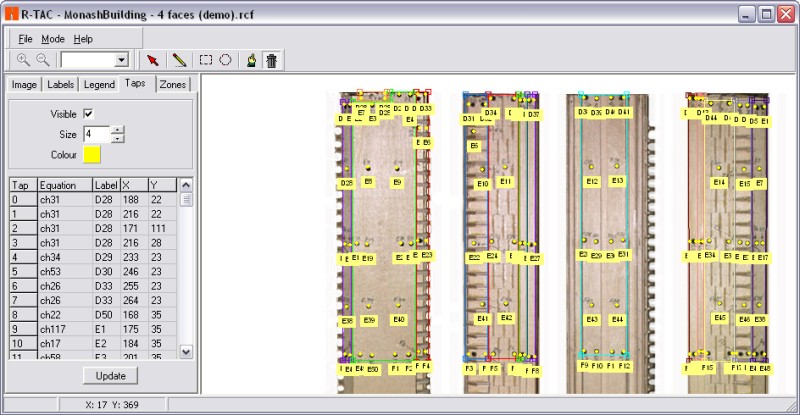
    With the configuration complete, pressure contours will be generated over the contour zones from the sampled channels of pressure data, in real-time. Other settings for the contour generation can also be specified and saved to the configuration file, e.g. contour triangulation level, opacity, range mode, colour map.

    Instantaneous pressure contours on the imported image during wind-tunnel testing

    Home Products Services Support Downloads Company

    Copyright © Turbulent Flow Instrumentation Pty Ltd